Dive into Twitter's recommendation system IV - SimClusters
Community-Based Representations for Heterogeneous Recommendations at Twitter
In this post, let’s go through the most advanced candidate retriever system in Twitter - SimClusters1. For the previous posts, please refer to
It’s the backbone of many product features in Twitter, including home feed, trends, who to follow, topic tweet recommendations, and personalized trend
It currently serves 35% of Home Timeline tweets, and it’s the primary source of out-of-network tweets
It successfully solved the unique problem of Twitter
Various cardinality, which affects the scale of the problem
Different Shelf life, which constrains latency of recommendation generation
The core algorithm is a simulation of NMF (sparse non-negative matrix factorization). But traditional MF methods cannot scale in Twitter’s big data
It proposes a two stages solution
Stage 1: community discovery based on Metropolis-Hastings sampling
Stage 2: batch and streaming processes to ingest the result and apply the intermediate result to different products
There are too many heuristic hyperparameters and settings in this algorithm, and I believe there is still much room to improve in the future
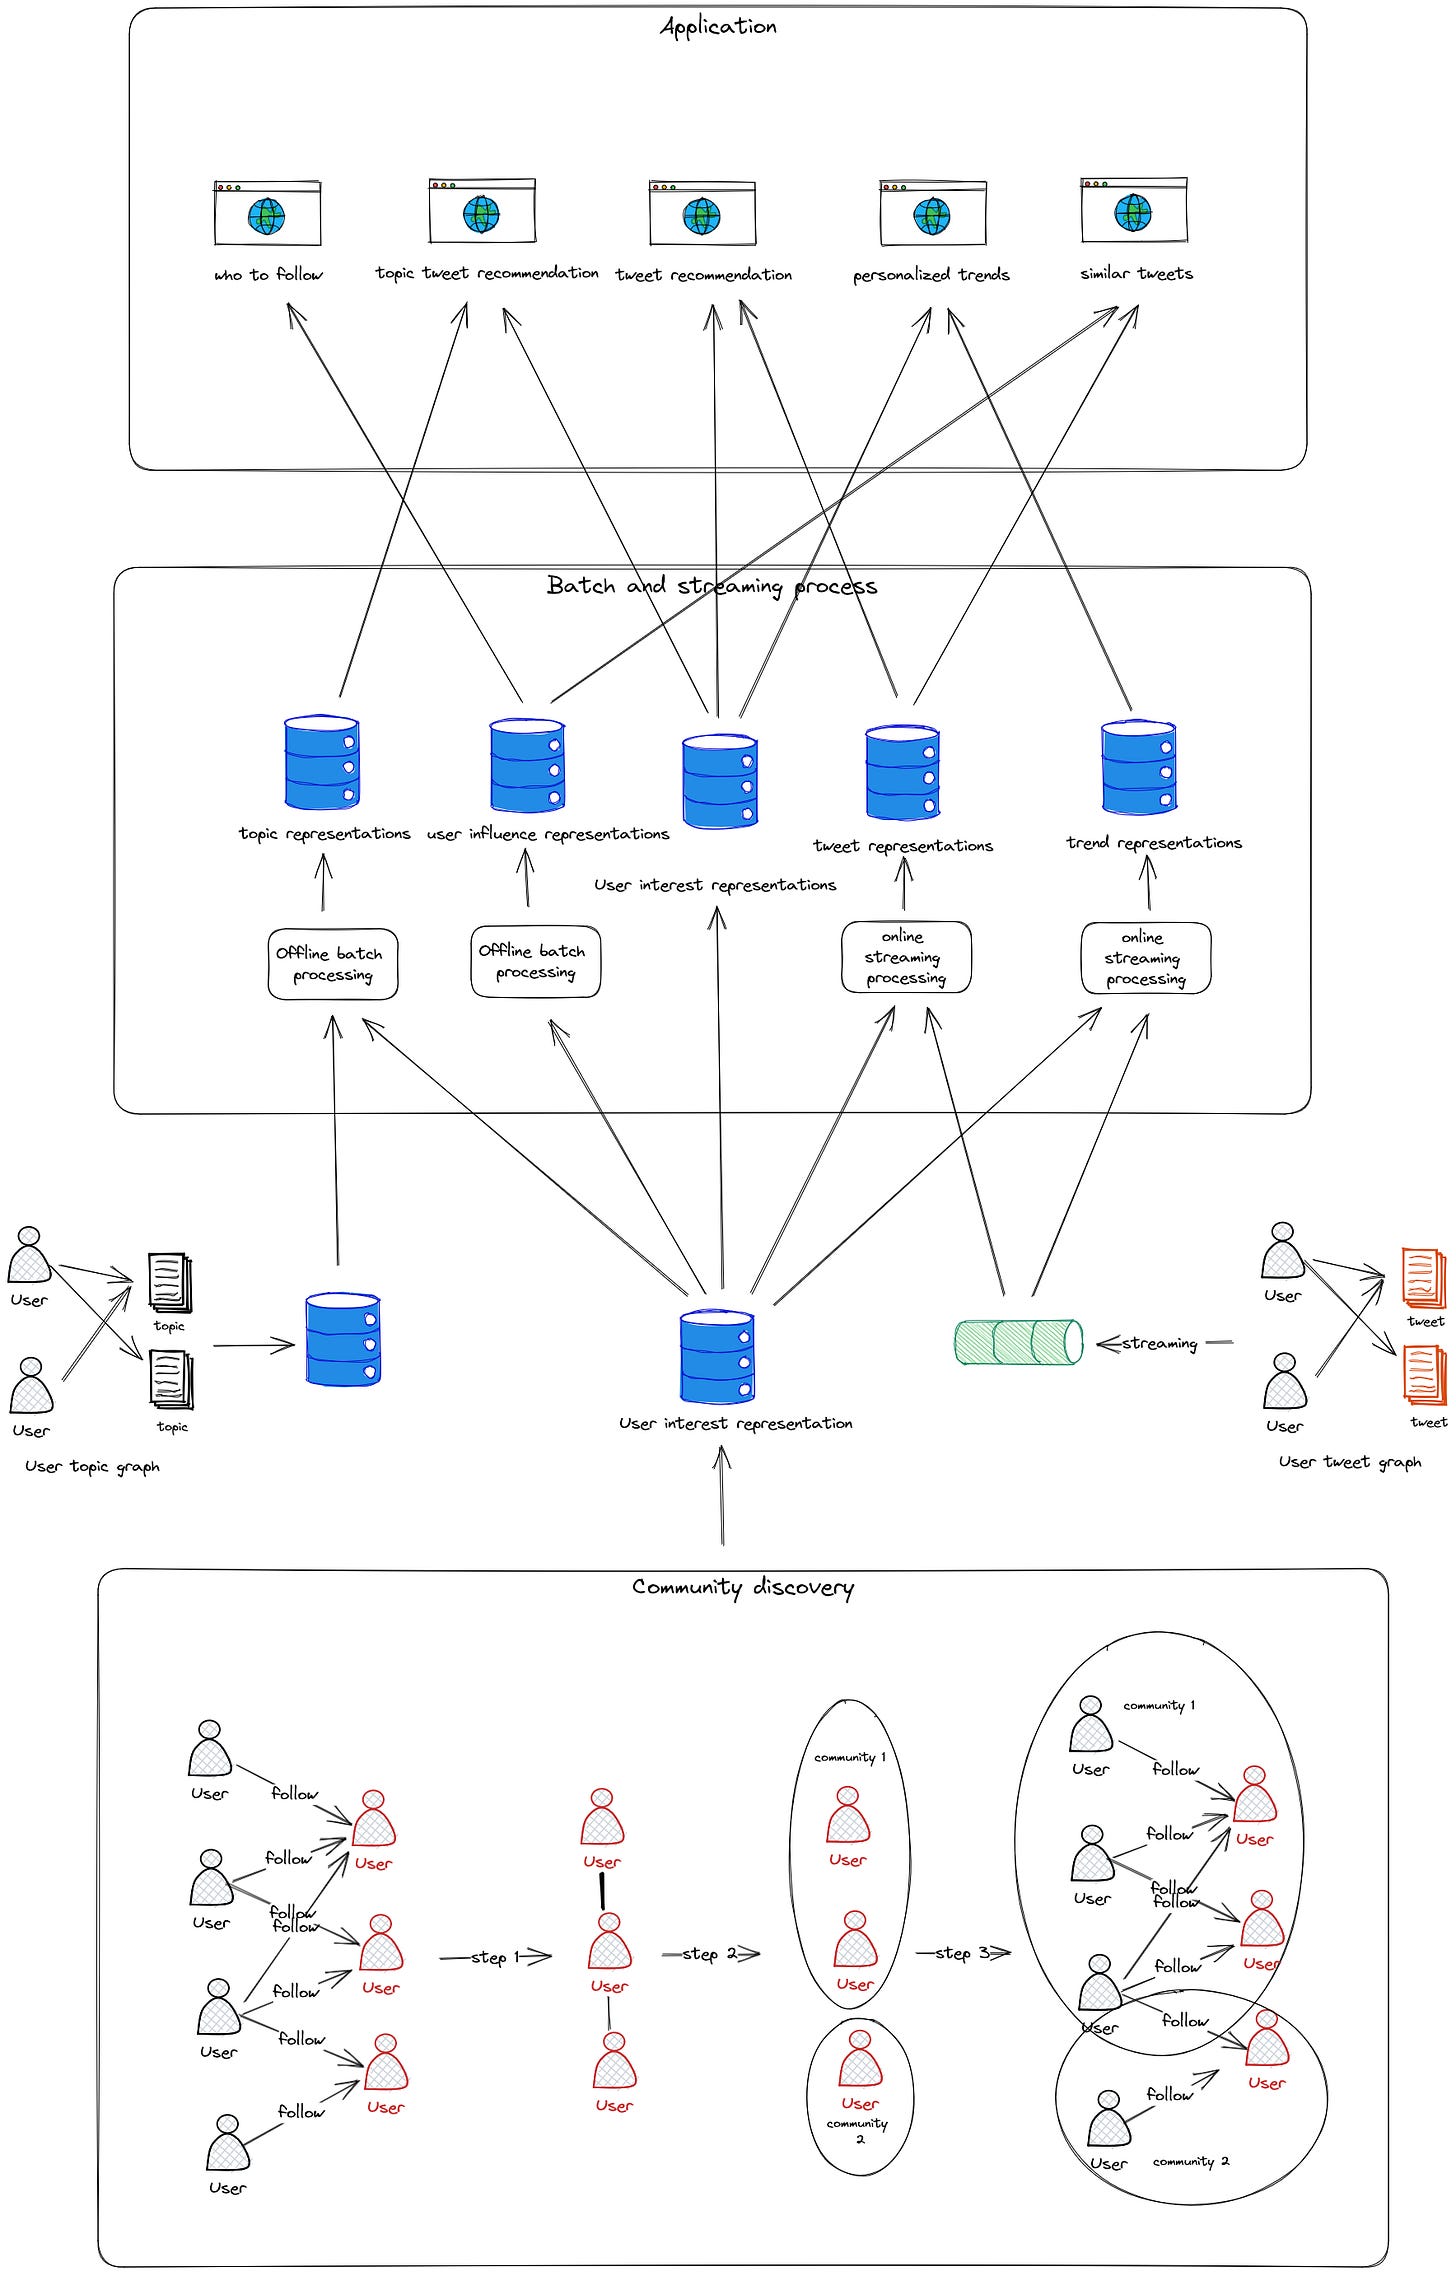
The overall architecture is listed below.
Paper reading
Introduction
Here Twitter introduces the two primary dimensions of their recommendation system:
The cardinality of the items being recommended. As we can see below, the cardinality varies a lot
The shelf life of the computed recommendations. For example, tweet recommendations become stale quicker and must be generated in a real-time online system
As we shared in RealGraph and GraphJet, they are designed to solve specific questions but cannot generalize well. This brings us to the motivation for building SimClusters:
build a general system that helps us advance the accuracy of all or most of the Twitter products which require personalization and recommendations
The core idea of this paper is :
from the user–user graph, construct a general-purpose representation based on community structure, where each community is characterized by a set of influencers that many people in that community follow
SimClusters have the following features:
Universal representations: Users and all kinds of content can be represented in the same vector space
Computational scale: SimClusters work well with ∼10^9 users, ∼10^11 edges between them, and 10^8 new Tweets every day with ∼10^9 user engagements per day
Accuracy beyond the head: SimClusters are accurate beyond the head content. My comment🤔: it’s reasonable because all the results are based on community, which is also a kind of content-based recommendation that generalizes well. But they don’t show the evidence in this paper.
Item and graph churn: Simclusters can adapt to dynamic items which rapidly rise
and diminish in popularity
Interpretability: Every dimension in the vector is a community. This has much better interpretability than MF or graph embedding. My comment🤔: how about the accuracy? I guess it should be worse, but MF and graph embedding cannot run at Twitter’s scale
Efficient nearest neighbor search: It’s easy to maintain inverted indices for retrieving tasks. My comment🤔: ANN search can also be applied here, but they don’t mention
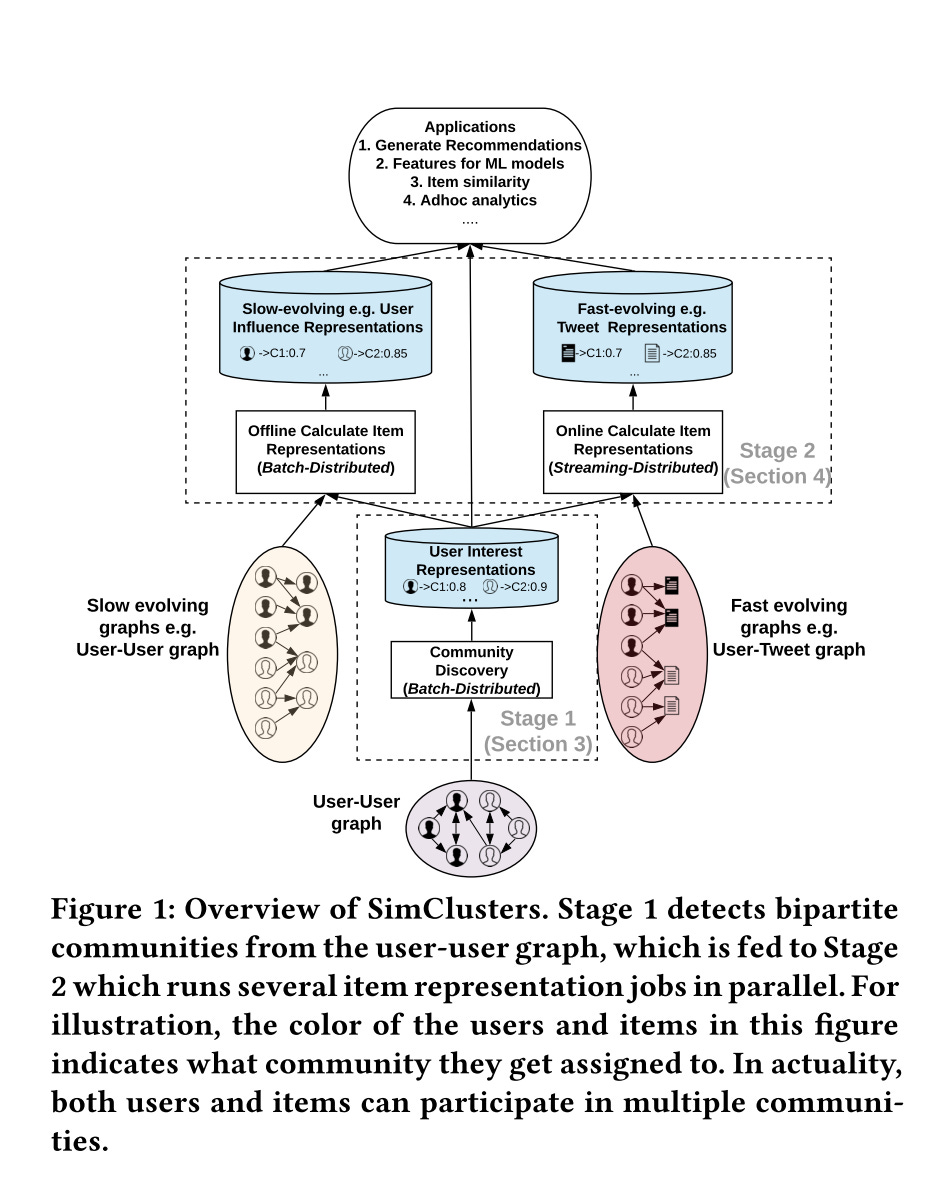
Overview of SimClusters
The overview is the same as I talked about before. Let’s give more details here:
Stage 1: Generate user community scores based on the user-user graph.
It is made available in both offline data warehouses as well as low-latency online stores, indexed by the user id.
This first stage is run in a batch-distributed setting
Compared to the user-tweet graph, the user-user graph evolves slowly and has higher coverage. So an offline batch job is suitable.
Stage 2: Several different jobs calculate the representations for specific recommendation targets. This job can be either batch or streaming, depending on the shelf life of the target. All the jobs are modularized and decoupled from each other, and the only dependency is on offline datasets or online key-value stores. My comment🤔: This is the first time I realized dependency on data is also a kind of decoupling
Community Discovery
Twitter still follows the idea from HITS. The users are decoupled into a bipartite graph:
Hubs: left side users who are interested in specific communities
Authority: right side users who are influential in specific communities
Naturally, the size of right-side users is much smaller than the size of left-side users because of the power-law distribution. To be specific
we find that we’re able to cover the majority of edges (numbering ∼10^11) in the full graph by including the top ∼10^7 most followed users in the right side, while the left side continues to include all users, which is ∼10^9.
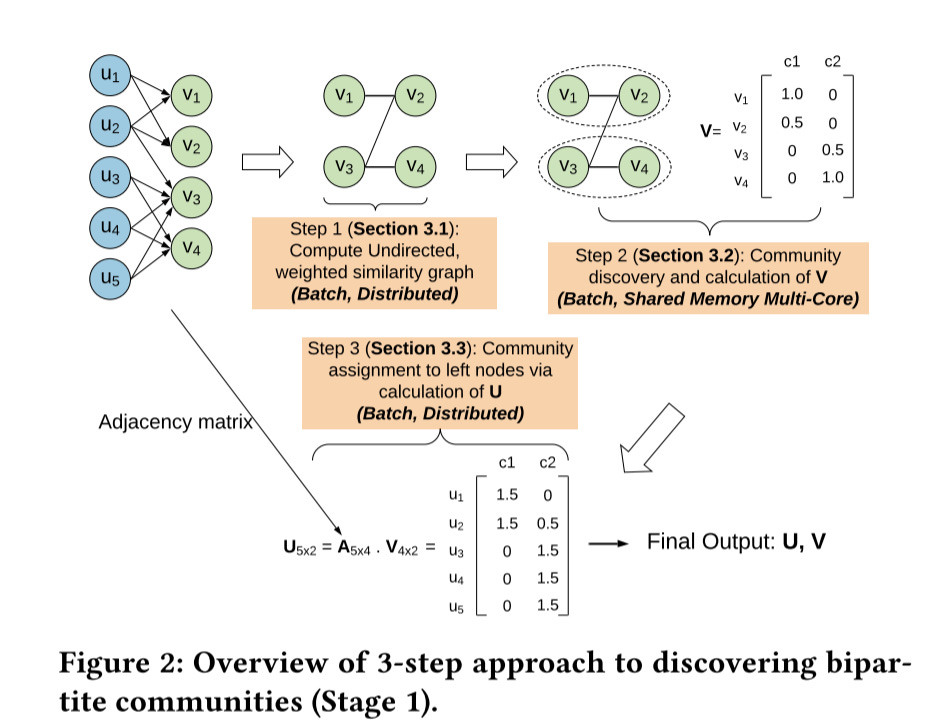
Actually, from a matrix-factorization point of view, this 3-step approach closely mirrors one way of performing SVD of a matrix via the eigen-decomposition. But all the NMF(sparse non-negative matrix factorization) methods cannot scale to Twitter’s huge dataset.
Step 1: Similarity Graph of Right Nodes
In this step, a smaller unipartite undirected graph 𝐺 is constructed over the nodes of the right partition. The right partition is used because it’s much smaller and less noisy.
The algorithm is quite simple:
define the weight between two users based on the cosine similarity of their followers on the left side of the bipartite graph
Low similar score users are discarded, and only keep the topK similar users
The calculation scale is enormous. This is solved by WHIMP2, which uses a combination of wedge sampling and Locality Sensitive Hashing (LSH)
The output is an undirected graph with ∼10^7 nodes and ∼10^9 edges. The scale shrinks to a shared-memory multi-core scale
Step 2: Communities of Right Nodes
The next step is to discover the communities. The objective function is defined below:
Z(𝑢) denotes the set of communities to which the vertex 𝑢 has been assigned
N (𝑢) denotes the set of neighbors of vertex 𝑢
The contribution of the first term(neighbors shared the same community) is up-weighted using the parameter 𝛼
In simple words, the object is to find the best communities set that can maximize the overlap of communities among all the neighbors
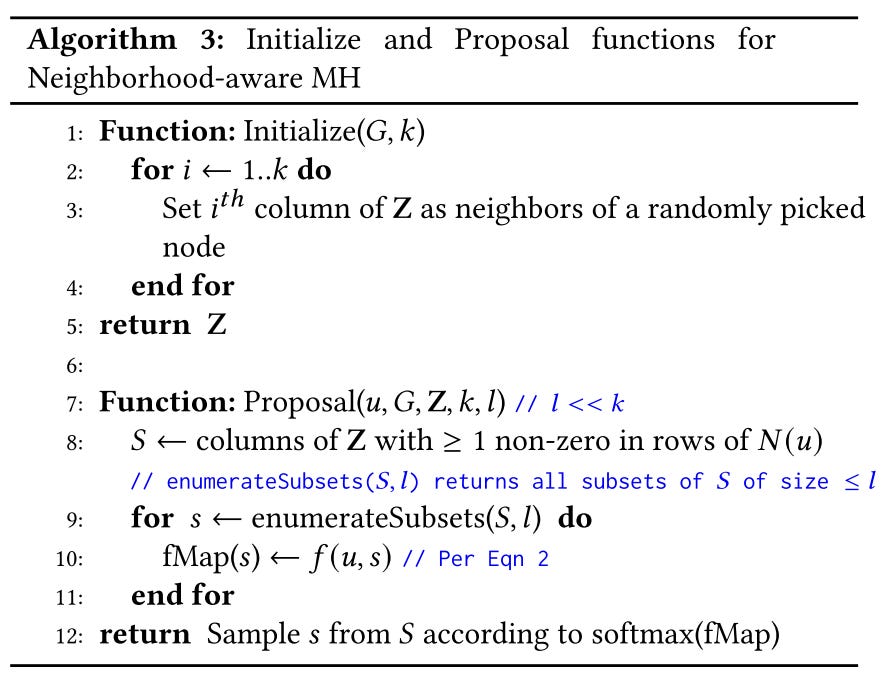
The algorithm is listed below:
This is a greedy approach: every time, it randomly generates a new community set for every vertex u at most T epochs
If the newly generated community set is better, replace the previous one
If it’s worse, still accept the new set with a certain probability in case of getting stuck in local minima
The naive approach of proposing a new community set is based on random sampling, but it cannot scale
Neighborhood-aware MH:
It is extremely unlikely that a node should belong to a community that none of its neighbors currently belong to
It is unnecessary to assign a node to more than a small number of communities
So the candidate communities are picked from the communities of neighbors
And another threshold is set as the upper bound of the maximal communities that can be assigned to
Then finally sample the subset 𝑠 with probability proportional to 𝑒^𝑓 (𝑢,𝑠)
i.e. apply the softmax
Step 3: Communities of Left Nodes
The final step is quite simple:
assign a left-node to communities by looking at the communities that its neighbors (which will all be right-nodes and hence already have assignments) have been assigned to.
This is done by multiplying the adjacency matrix and setting U = 𝑡𝑟𝑢𝑛𝑐𝑎𝑡𝑒 (A · V), where the 𝑡𝑟𝑢𝑛𝑐𝑎𝑡𝑒 function keeps only up to a certain number of non-zeros per row to save on storage.
Item Representations
The next stage is to build the representations for all items. This is also straightforward:
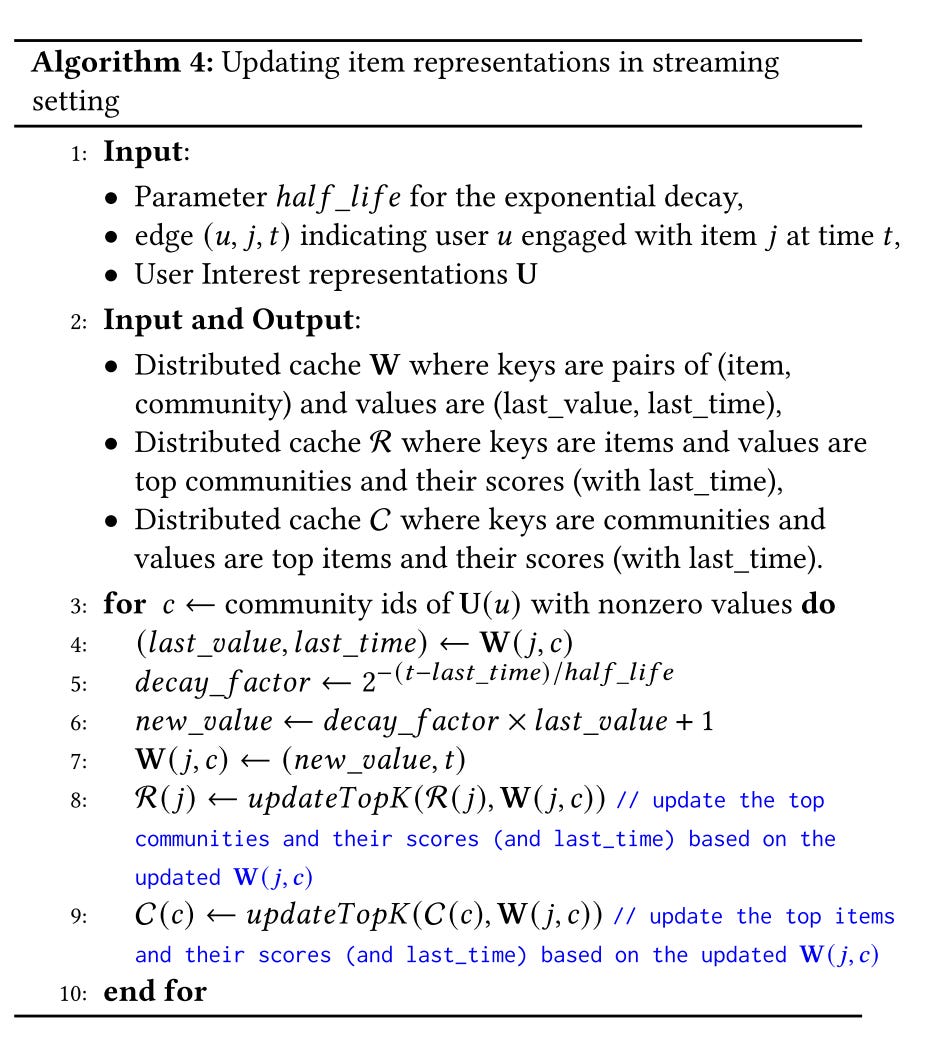
compute an item’s representation by aggregating the representations of all the users who engaged with it
Exponentially time-decayed average as the 𝑎𝑔𝑔𝑟𝑒𝑔𝑎𝑡𝑒 function, which exponentially decays the contribution of a user who interacted with the item based on how long ago that user engaged with the item
Shorter shelf life has a shorter half-life
Keep two summary statistics for each cell in W - the current average itself and the last timestamp when it was updated
R and C sets are also recorded for the top communities and vice versa
My comment🤔: this is actually a real-time time decay pipeline very commonly used in calculating real-time interests
Deployment Details
In production, there are ∼10^5 communities in the representations
The communities are extracted from the similarity graph of the top ∼10^7 users by follower count
The final graph contains nearly 70% of the edges in the input bipartite graph
Within Stage 1:
Step 1 (similarity calculation) is the most expensive step, taking about 2 days to run end-to-end on Hadoop MapReduce
For step 2, the community matrix is updated incrementally, which means it’s only built from scratch for the very first time
For stage 2:
Two batch jobs, one for user influence representations and one for Topic representations
The user influence representations tell us what communities a user is influential in, and they have better coverage and are denser. No details about how to generate it. My comment🤔: should be another round of aggregation, like the most followed people in certain communities
The topic representations are generated on the user interest representations and user-topic engagement graph. My comment🤔: the user-topic graph should also be a kind of aggregation on the user-tweet-topic behaviors
Two streaming jobs, one for Tweet representations and one for
Trend representationsThey are all generated by consuming the streaming user-tweet engagements
Applications
As I pointed out in the overall architecture picture, different intermediate representations are further outputted to downstream products
Similar Tweets on Tweet Details page
Adding two candidate sources:
Similar tweets based on tweets representations from SimClusters using cosine similarity. The new candidates have a +25% higher engagement rate
Retrieve Tweets whose SimClusters representation has high cosine similarity with the user influence representation of the author of the main Tweet on the page. Overall engagement increased by +7%
Tweet Recommendations in Home Page
Also, adding two candidate sources:
Retrieve tweets whose real-time representation has the highest dot-product with the viewing user’s interest representation
Item-based collaborative filtering: uses the same underlying implementation as the “Similar Tweets” application. Identify Tweets similar to those Tweets which the user has recently liked
The engagement rate of new candidates is 33% higher than that for candidates generated by GraphJet
The overall engagement increased by 1% for Twitter
Add as a feature for ranking:
The model trained with these features was able to increase the engagement rate of recommended content by 4.7% relatively
Ranking of Personalized Trends
Scoring Trends for a given user by using the dot-product of the user’s interest representation along with the real-time representation for a Trend
8% increase in user engagement with the Trends themselves
12% increase in engagement on the landing page subsequent to a click
Topic Tweet Recommendations
Identifying tweets whose SimClusters representation has high cosine similarity with the representation of the query topic, and then applying the textual matching rules
Show positive result, no detailed number mentioned
Ranking Who To Follow Recommendations
Adding new features based on the SimClusters representations of the viewing user and the candidate user
Increase of 7% in the follow rate
My comment🤔: not mention what representations they are using, I think both interest and influence representations are useful here
Applications in progress
Notifications quality filter
Build SimClusters representations for users based on the user–user block graph and
use these representations as features to train a model for filtering out abusive and spammy replies. (👏 good idea)
Supervised embeddings from feature combinations
Input as features to two-tower models for the engagement prediction model. (👏 they are trying two-tower lol)
Real-time Event notifications
Identify candidate users for real-time events based on the event representation and user interest representation
Related Work
In this part, Twitter shares its thoughts on different models
Graph embedding, or VAE, fits separate parameters for each user or item, but they cannot scale
Hybrid models, such as Factorization Machine and Deep Neural Networks (DNNs) have fewer parameters
But they require either well-defined feature vectors or pre-trained embeddings from auxiliary tasks as the input representation of users and items
My comment🤔: this is not a strong reason. As we know, in RealGraph, they already developed tons of user features. For item features, they can use NLP models to generate embeddings for tweets
Graph Convolutional Networks (GCNs) perform well in domains where the
items have a good set of pre-existing features, e.g., where the items
are imagesBut GCN performs worse in the absence of useful content features and cannot deal with the short half-life of items either
My comment🤔: this is neither a strong reason. NLP embeddings are strong tweet features. The main issue is the short half-life of tweets, but this still can be solved by applying a two-stage algorithm:
Build GCN on old tweets data on a daily or weekly basis
Aggregate or group new tweets to the old tweets, and use the average of old tweets embedding as the representations of new tweets. NLP embeddings can calculate the similarity
I believe GCN should have better results in the community representations
My Final Words
We can see that SimCluster has pros in interpretability, generalization, and real-time scaling. But it’s still just a mimic of the MF algorithm. From a modeling perspective, many improvements can be made in the future.
It’s focused on Graph learning and representation, and we know that graph relationship is the most important feature of Twitter. And all the previous work on Twitter also focuses on Graph. This makes sense, but I still want to ask, how about the tweet? Is the tweet more or equally important as the user? If so, how about trying two-tower like YouTube?
Two many heuristic rules in this algorithm, which basically means the end-to-end approach can work much better without subtle tuning
GCN is promising. I hope Twitter can put more resources into at least an offline evaluation of it
Weekly Digest
The Illustrated Machine Learning website. A very cool website illustrates the core machine-learning concepts
AI's Hardware Problem. Deep learning's memory wall problem
Towards Complex Reasoning: the Polaris of Large Language Models. A summary of methods toward models of strong complex reasoning capabilities
Google "We Have No Moat, And Neither Does OpenAI". Leaked Internal Google Document Claims Open Source AI Will Outcompete Google and OpenAI
Science is a strong-link problem. Some problems are strong-link problems: overall quality depends on how good the best stuff is, and the bad stuff barely matters
What’s Next
Let’s go to the final paper for Twitter, MaskNet: Introducing Feature-Wise Multiplication to CTR Ranking Models by Instance-Guided Mask.3
https://dl.acm.org/doi/pdf/10.1145/3394486.3403370
https://arxiv.org/abs/1703.01054
https://arxiv.org/pdf/2102.07619.pdf









These break downs are amazing Fan! Thank you. (looked for you on twitter but didn't find an active profile)